
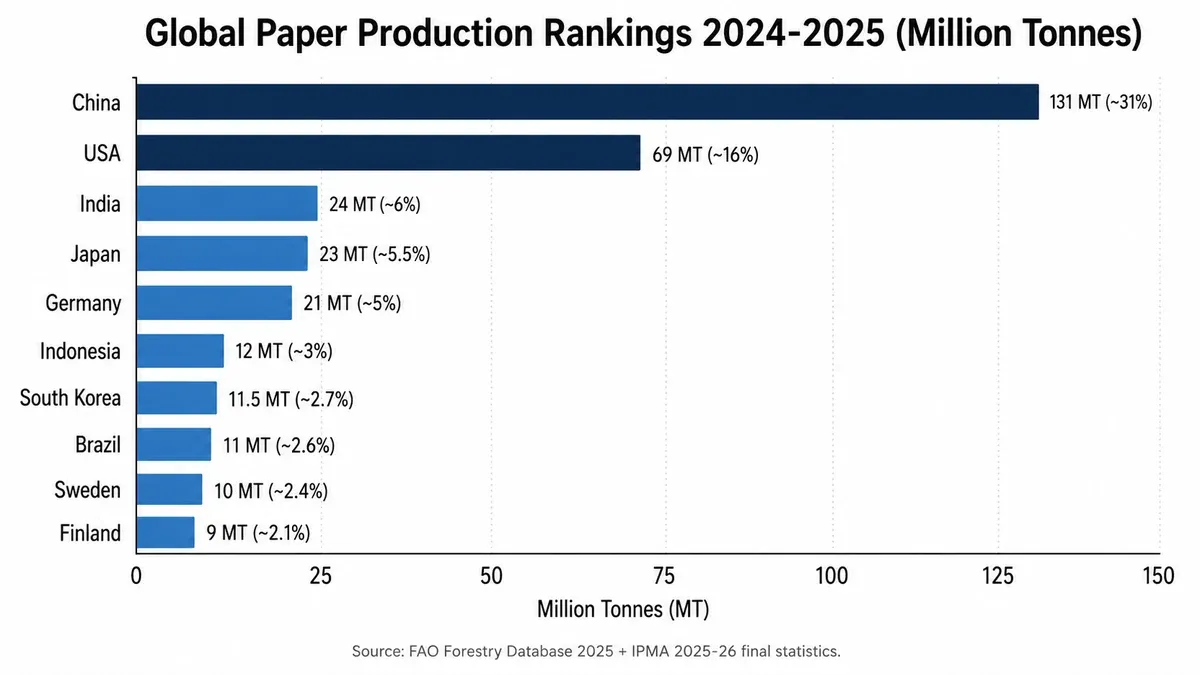
Quick Answer: China leads global pulp and paper production with about 131 million tonnes annually (about 31 percent of global output), followed by the USA (69 million tonnes, 16 percent), Japan, India, and Germany per FAO Forestry Database 2025 statistical yearbook. The top 10 producing countries account for over 75 percent of the around 419 million tonnes produced in 2024 with 2025 estimates near 425 million tonnes and Q1 2026 outlook around 430 million tonnes.
Last updated: 13 May 2026 by the World Paper Mill editorial team. Sources: FAO Forestry Database 2025, CEPI preliminary statistics February 2026, AF&PA Q1 2026 outlook, IPMA 2025-26 final statistics.
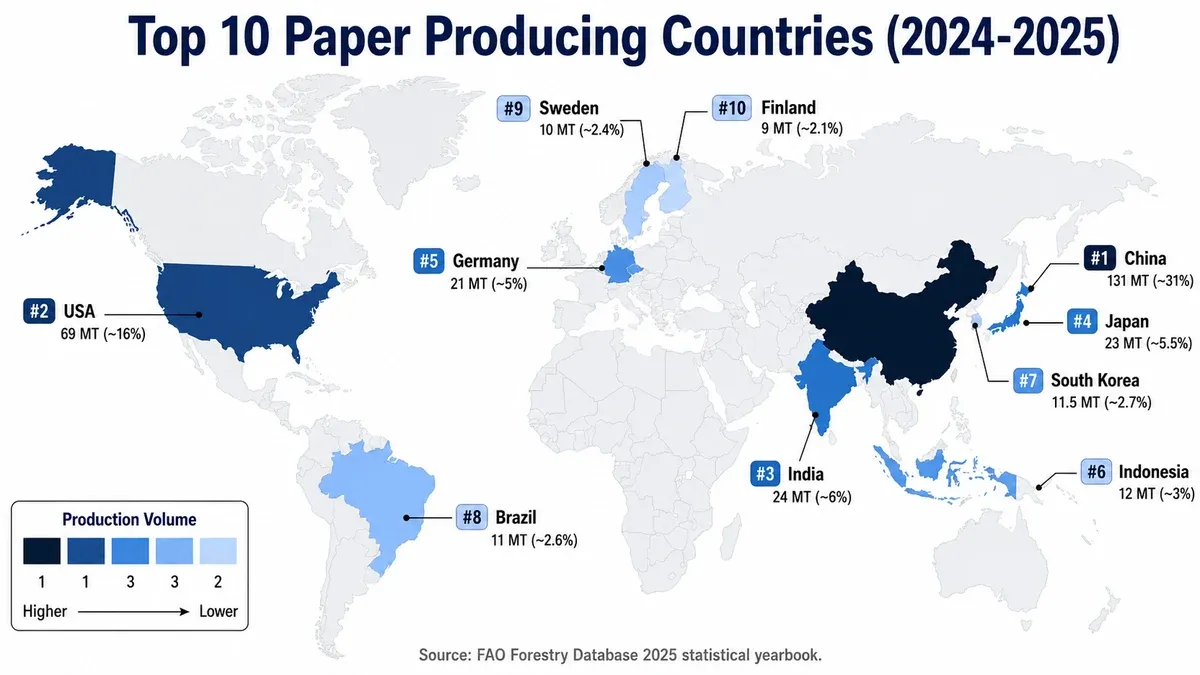
Top 10 Pulp and Paper Producing Countries
The pulp and paper industry is dominated by Asia, which accounts for over half of global production. China alone produces nearly one-third of all paper made worldwide (roughly 31 percent in 2024-2025). North America and Europe follow as the second and third largest producing regions. Production rankings have shifted notably over the past decade: China overtook the United States in 2009 to claim the global top spot, and India is rising fast to challenge Japan and Germany for positions 3-5.
Source: FAO Forestry Database 2025 statistical yearbook (covering 2024 latest published data) with 2025-2026 estimates from CEPI preliminary statistics February 2026, AF&PA Q1 2026 outlook, IPMA 2025-26 final statistics, and RISI 2026 China outlook. Tonnage figures are approximate and rounded; specific country-level figures vary slightly by methodology.
Paper Production by Region
Asia: The Dominant Region
Asia produces near 55 percent of global paper and paperboard, anchored by China (~31 percent of global output) and supported by India, Japan, Indonesia, and South Korea. China expanded capacity by ~ 12 million tonnes between 2022 and 2025 to support domestic packaging and tissue demand plus capture export market share, which has reshaped global trade flows (FAO 2025). For more on China's recent capacity expansion and export surge, see our analysis of China paper overcapacity disrupting global markets.
India is the fastest-growing major producer, with consumption rising an estimated 6-7 percent annually and packaging paper growing 8.2 percent through 2025-2026 (IPMA 2025-26 final statistics). Indian mills are increasingly bagasse and recycled-fiber based to reduce dependence on virgin wood imports. See our detailed analysis of the growth of the paper industry in India for capex, capacity, and forecast detail.
Europe: Premium Specialty Producer
Europe accounts for on the order of 17 percent of global paper production, led by Germany, Sweden, Finland, Italy, and France. European mills focus on premium packaging, specialty technical paper, and high-yield kraft. Production declined about 1.5 percent in 2025 due to elevated industrial energy costs and structural decline in graphic paper demand (CEPI preliminary statistics February 2026). The European Union Industrial Emissions Directive 2024 implementation is accelerating mill consolidation in graphic-paper segments.
North America: Containerboard and Kraft Stronghold
North America produces around 17 percent of global paper, dominated by the USA with Canada playing a strong supporting role in softwood pulp. North American mills lead globally in containerboard, kraft paper, and recycled-fiber capacity. The 2024 Smurfit Westrock merger (formed from WestRock and Smurfit Kappa) reshaped the regional competitive landscape and the broader ranking of the world's largest paper manufacturers. For deeper context on recent capacity rationalization, see paper mill closures and industry restructuring.
Latin America: Pulp Export Powerhouse
Latin America accounts for roughly 6 percent of paper production but a much larger share of global pulp exports. Brazil leads globally in bleached eucalyptus kraft (BEK) pulp, with Suzano operating some of the world's largest single-site pulp mills. Chile, Uruguay, and Argentina also export significant pulp volumes. Latin American mills benefit from short eucalyptus rotation cycles (7 years vs 25-40 years for northern softwood) delivering structural cost advantages.
Why Production Rankings Are Shifting
Five structural forces are reshaping country-level paper production rankings through 2026:
- China consolidation: Massive vertical integration (Nine Dragons, Lee & Man, Sun Paper, Huatai) creates scale advantages competitors cannot match. China grew share from near 25 percent in 2015 to ~ 31 percent in 2025 (FAO 2025 yearbook + RISI 2026 China outlook).
- India growth: Domestic packaging and tissue demand growing 6-7 percent annually; India is on pace to displace Japan or Germany from top-3 position by 2027-2028 (IPMA 2025-26).
- European contraction: Mill closures concentrated in graphic-paper segments; European production fell ~1.5 percent in 2025 with continued mild contraction expected through 2026 (CEPI February 2026).
- North American consolidation: Capacity rationalization in graphic paper offset by packaging conversion; net production roughly flat through 2025-2026 (AF&PA Q1 2026).
- Brazilian pulp dominance: Suzano, Klabin, and CMPC continue capacity expansion in bleached eucalyptus kraft (BEK). Brazil supplies a significant share of global hardwood pulp imports.
Raw Materials by Country
The dominant fiber source varies dramatically by country, reflecting forest availability and historical industrial development:
- China, USA, Japan, South Korea: Mixed virgin softwood/hardwood + heavy recycled fiber (60-70 percent of furnish)
- India, Indonesia: Non-wood fiber (bagasse, bamboo) plus recycled fiber
- Brazil, Uruguay, Chile: Plantation eucalyptus hardwood pulp (export-oriented)
- Sweden, Finland, Canada: Boreal softwood (pine, spruce, fir): globally important softwood pulp source
- Germany, Italy, France: Recycled fiber heavy + imported pulp (limited domestic forest)
For full raw material category breakdown across all countries, see our comprehensive raw materials for paper industry guide.
Industry Context: Global Paper Production 2025-2026
Global paper and paperboard production reached an estimated 419 million tonnes in 2024 (FAO Forestry Database 2025 statistical yearbook, latest published), 2025 estimates ~425 million tonnes, Q1 2026 outlook ~430 million tonnes. Industry composition by end-use sector:
- Packaging: On the order of 60 percent of global production. Growth driver: e-commerce and food service (3-5 percent annual growth per AF&PA 2025-2026)
- Graphic paper (newsprint + writing/printing): About 15 percent. Structural decline of 4-7 percent annually (AF&PA 2025).
- Tissue and hygiene: Around 11 percent. Growth driver: hygiene awareness, population growth (2-3 percent annually per CEPI 2025).
- Specialty grades: Roughly 14 percent. Stable to growing; includes food-grade barrier paper, security paper, decorative laminate base.
For full process detail on how this paper is produced, see our 10-step paper production process guide.
About This Guide
This top paper producing countries guide is compiled by the World Paper Mill editorial team, a group of pulp and paper industry researchers focused on machinery, capex, and market intelligence content for mill operators and project investors. Production tonnage figures are cross-checked against FAO Forestry Database 2025 statistical yearbook, CEPI preliminary statistics (February 2026), AF&PA Q1 2026 outlook, IPMA 2025-26 final statistics, and direct country-level industry associations. Specific tonnage and ranking positions vary slightly between sources due to methodology differences; the figures here use FAO as the canonical authoritative source.
References & Sources
- FAO Forestry Database: 2025 statistical yearbook covering global paper and paperboard production by country.
- CEPI: Confederation of European Paper Industries preliminary statistics February 2026.
- AF&PA: American Forest and Paper Association Q1 2026 outlook.
- IPMA: Indian Paper Manufacturers Association 2025-26 final statistics.
- China Paper Association: 2025 domestic production and trade data.
- Fastmarkets RISI: 2025-2026 global pulp and paper market intelligence.
- ABTCP: Brazilian Technical Association of Pulp and Paper, 2025-2026 Brazil production data.
All production tonnage figures are approximate and rounded to nearest million tonne. Specific country-level reporting cadence and methodology differ between sources (FAO uses calendar-year reporting; some national associations use fiscal-year). Validate against current FAO and country-association reporting for transaction-level detail.


